First Quarter 2026 Review
Personalized Portfolios account: Total Return Investment Approach
By Strategic Advisers, LLC
Market Landscape
Markets navigated volatility as geopolitical tensions pushed energy prices higher.
The Big Picture
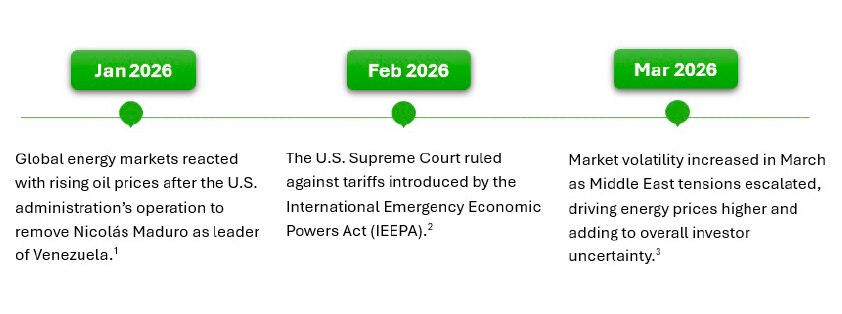
The first quarter of the year saw world events drive volatility in global stock and bond markets. Early in the quarter, energy prices increased following U.S. operations in Venezuela. Markets faced policy uncertainty after the U.S. Supreme Court struck down tariffs imposed under IEEPA. The effects of this ruling were short-lived as the U.S. administration worked to reintroduce similar tariffs. Middle East tensions led to an additional upturn in global energy prices with oil rising nearly 60% in March.4 Higher energy prices led to increased expectations for further inflation. The U.S. job market sent mixed signals during the quarter. U.S. payroll numbers bounced back in March after declining in February, ending the quarter with higher-than-expected job growth. Meanwhile, wages experienced limited gains, rising only 0.2%, and unemployment remained steady and well-below its long-term average.5 Entering 2026, markets largely anticipated interest rate cuts from the U.S. Federal Reserve Bank (Fed) during the year. However, that expectation shifted during the first quarter as the Fed chose to hold interest rates steady. This decision came against the backdrop of rising energy prices, tariff concerns, and job market uncertainty.
Both international and U.S. stocks fell during the quarter. However, international stocks fell by only 0.7%, while U.S. stocks dropped 4.0%.6 Even though they have greater risk exposure to Middle Eastern oil, international stocks were likely better positioned to weather last quarter’s turbulence due to strong earnings and more attractive valuations compared to U.S. stocks.7 Meanwhile bond market returns were nearly flat as interest rates rose, prompted by concerns related to higher inflation.8
Looking ahead:
Uncertainty stemming from Middle East tensions may continue to linger over global markets. Ongoing tensions may result in prolonged periods of elevated oil prices which could lead to more moderate global economic growth and corporate profits. On the other hand, a potential forthcoming resolution could quickly improve investor confidence and fuel a global market rally. If inflation begins to show signs of easing, interest rates could stabilize or move lower. Declining interest rates could lead to lower borrowing costs for consumers and businesses and may help to support both stock and bond market returns.
Historically, major geopolitical conflicts have tended to cause short-term market volatility rather than long-term declines. Markets have typically stabilized and delivered gains within a year as uncertainty declined. Maintaining a diversified investment portfolio can play an important role in helping investors weather periods of market volatility. Diversified investment portfolios can include exposure across stocks and bonds, as well as diverse assets like commodities, alternative investments, Treasury Inflation-protected Securities (TIPS), real estate investments, and high-yield bonds.
DID YOU KNOW?
Analysts can use airport crowd size and airline passenger traffic as real-time indicators of economic health. Crowded airports signify that consumers have discretionary income to spend on leisure travel and vacations. They also show that companies are sending employees on business trips, which often indicate sales activity, business investment, and expansion.
Positioning Landscape
We have adjusted our positioning to help manage risk and potentially mitigate the impact of inflation.
U.S. Stocks:
- We maintained exposure to U.S. stocks as earnings growth outlook remains strong in 2026, despite Middle East tensions.
- We favored value stocks and small- to mid-sized companies. These are areas of the market with lower valuations (i.e. inexpensive) that may benefit from a growing economy and broadening earnings growth beyond technology stocks.
- We have maintained less exposure to very large companies due to high valuations, as they may experience bouts of volatility even as their earnings potential remains strong.
- Our focus has remained on core, research-driven managers that follow a disciplined process based on fundamental analysis of individual companies.
- We have some exposure to real estate stocks, including data centers and cell phone towers. We believe this real estate exposure could potentially help provide some protection from inflation.
International Stocks:
- International developed markets have positive earnings and economic growth outlooks. As a result, we increased exposure to international developed markets while trimming exposure to emerging markets.
- We have remained focused on managers who invest in smaller companies in developed markets, and are emphasizing more value and quality companies within emerging markets8a.
- Like U.S. stocks, we have less exposure to very large companies due to high valuations within DM, while EM has less exposure to India due to high valuations and softer growth outlook.
Bonds:
- We decreased exposure to investment-grade bonds in favor of U.S. stocks as U.S. economic growth may bolster stocks and higher inflation may lead to some bond market volatility.
- We maintained duration (a measure of interest rate sensitivity) similar to the benchmark8b. This means that as interest rates rise or fall, we believe that the strategy’s bond exposure is likely to react similarly to the benchmark.
- When compared with the strategy’s benchmark allocations, we have more exposure to mortgage-backed securities (MBS), intermediate Treasuries and TIPS, with less exposure to corporates and long-duration. We believe MBS have had a more favorable economic outlook than Treasuries and more attractive valuations than corporate bonds.
- We have maintained exposures to Treasury Inflation-Protected Securities (TIPS) and increased commodity exposure to help guard against potential inflationary pressures.
- We have also kept an allocation to high-yield corporate bonds in an effort to provided additional income, with the view that default risk has remained historically low.
Other:
- Finally, we have exposure to alternative investments with low correlation to traditional asset classes (i.e. stocks and investment-grade bonds). These investments have the potential to provide stability during periods of stock and/or bond market volatility.
The following investment types discussed here are for general informational purposes. All asset class categories referenced may not be represented within your specific strategy.
Asset Classes – A Closer Look
Both stocks and bonds declined in the first quarter.
U.S. Stocks9 -4.0% QTR
Geopolitical uncertainty weighed down consumer sentiment.
Broad U.S. equity markets ended the quarter lower as investors weighed strong earnings and outlooks against global risks tied to energy prices and inflation. Large company stocks lagged the broader U.S. stock market, as growth sectors, particularly information technology and communication services, faced scrutiny over high (i.e. expensive) valuations and AI spending.10
Small and mid-sized companies outperformed their larger counterparts, producing positive returns for the quarter.11 These companies have been supported by solid earnings growth and more attractive (i.e. less expensive) valuations. For the last two quarters, value stocks have outperformed growth.12 Energy stocks, propelled by rising oil prices, were the primary driver for value stock outperformance last quarter. Meanwhile, growth stocks lagged as the information technology and communication services sectors struggled.
Dividend-paying stocks benefited from strength in defensive sectors such as utilities and consumer staples, both of which delivered strong, positive returns of 8.3% and 7.7% for the quarter, respectively.13 Additionally, energy-oriented areas of the market provided some resilience amid market volatility. Dividend-paying stocks tend to overlap substantially with value stocks and performed well amid the quarter’s value-stock rally.
Commodities overall experienced gains of 24.4%.14 Within commodities, as stated above, oil prices surged during the quarter in response to geopolitical disruptions, driving an exceptionally strong return of 38.3% across energy stocks.15 Agricultural products as well as precious and industrial metals also posted solid gains for the quarter.16
Real estate investment trusts (REITs) delivered positive quarterly performance, returning 3.8%, supported by continued economic growth, lower interest rates over the previous year, and limited supply.17
International Stocks18 -0.7% QTR
Lower valuations and strong earnings supported international markets despite geopolitical challenges.
Although International stocks were slightly negative they did outperformed U.S. stocks during the first quarter.19 International developed markets benefited from favorable valuations at the beginning of the quarter and solid earnings growth. These characteristics helped international stocks to weather last quarter’s turbulence better than U.S. stocks, despite having greater economic exposure to Middle Eastern oil.
Japanese stocks posted a positive return of 1.5%.20 This outperformance was supported by a constructive economic outlook and improving corporate governance and earnings. Canadian stocks returned 1.4%, aided by relative energy independence from the Middle East.21 In Europe, Germany and France lagged, as higher oil and natural gas prices weighed more heavily on their economies.22
Emerging markets finished the quarter nearly flat, with an overall return of -0.2%.23 Brazilian stocks excelled, returning a substantial 19.2%. Brazil benefited from domestic oil production, which helped offset global energy pressures. South Korea continued its strong momentum from last year, delivering a 16.7% return. South Korean stock performance was driven by demand for critical technology exports. In contrast, India and China declined 18.1% and 8.9%, respectively, as higher energy costs clouded their growth outlooks. 24
Bonds25 -0.1% QTR
Rising rates put downward pressure on bond returns.
The bond market started off the quarter with positive results, but those returns were offset by an increase in geopolitical risk in March, which caused interest rates to rise and bond prices to fall. Oil prices surged as Middle East tension escalated with a potential rise in inflation appearing more likely. Hopes for additional Fed interest rate cuts in 2026 diminished. As a result, broad market investment-grade bonds declined slightly during the quarter.26 Corporate bonds underperformed government bonds, reflecting greater uncertainty around corporate earnings due to rising energy costs.27 Against a backdrop of rising interest rates, the limited-duration and intermediate segments of the investment-grade bond market experienced positive performance for the quarter, both returning 0.1%.28 Meanwhile, short-term bonds provided some stability during the quarter’s volatility, returning a positive 0.9%.29
Amid the perception of increasing market risk, higher-quality bonds rated AAA and AA outperformed bonds with lower credit quality ratings.30 High-yield bonds declined as rising energy costs increased concerns around corporate profitability.31 Municipal bonds fell 0.2%, driven by higher interest rates, inflation concerns, and weaker investor
demand.32 Similar to the broader investment-grade bond market, the limited-duration segment of the municipal bond market experienced positive performance.33 However, the intermediate segment of the municipal bond market fell for the quarter.34
TIPS outperformed other bond market segments, benefiting from their built-in inflation protection, returning 0.3%.35
For Additional Information, please view our Quarterly Market Perspective (opens in new tab or window)
The foregoing commentary was prepared by Strategic Advisers LLC, a registered investment adviser and a Fidelity Investments company.
1 Oil prices increased 17.8% for the month of January as measured by the Brent Crude Oil ($/bbl) spot price, as of 1/31/2026.
2 Supreme Court of the United States International Emergency Economic Powers Act (IEEPA), 2/20/2026.
3 Market volatility is measured by the CBOE Volatility Index, as of 3/31/2026.
4 Oil prices increased 57.8% between 3/2/2026 and 3/30/2026 as measured by the Brent Crude Oil ($/bbl) spot price.
5 Bureau of Labor Statistics, Employment Situation Summary, released 4/3/2026.
6 MSCI All Country World ex U.S. Index (Net MA Tax) and the Dow Jones U.S. Total Stock Market Index, respectively, as of 3/31/2026.
7 Based on trailing price-to-earnings ratios for the MSCI All Country World ex U.S. Index and the S&P 500 Index, respectively, as of 3/31/2026.
8 Bloomberg U.S. Aggregate Bond Index, as of 3/31/2026.
8a Quality companies tend to have more stable earnings and lower levels of debt than the broader market.
8b Bloomberg U.S. Aggregate Bond Index.
9 Dow Jones U.S. Total Stock Market Index, as of 3/31/2026.
10 Large company stocks are represented by the S&P 500 Index, and the broader U.S. stock market is represented by the Dow Jones U.S. Total Stock Market Index. Technology and consumer services returns are based on a sector breakdown of the S&P 500 Index, as of 3/31/2026.
11 Represented by the Russell 2000 Index and the Russell MidCap Index, respectively, as of 3/31/2026.
12 Represented by the Russell 1000 Value Index and the Russell 1000 Growth Index, respectively, as of 3/31/2026.
13 Based on a sector breakdown of the S&P 500 Index, as of 3/31/2026.
14 Bloomberg Commodity Index, as of 3/31/2026.
15 Based on a sector breakdown of the S&P 500 Index, as of 3/31/2026.
16 S&P GSCI Agriculture and Livestock Index, Bloomberg Precious Metals Index, and Bloomberg Industrial Metals Index, respectively, as of 3/31/2026.
17 FTSE NAREIT All Equity REITS Index, as of 3/31/2026.
18 MSCI All Country World ex US Index (Net MA Tax), as of 3/31/2026.
19 MSCI All Country World ex US Index (Net MA Tax) and Dow Jones U.S. Total Stock Market Index, as of 3/31/2026.
20 MSCI Japan Index, as of 3/31/2026.
21 MSCI Canada Index, as of 3/31/2026.
22 MSCI Germany Index and MSCI France Index, respectively, as of 3/31/2026.
23 MSCI Emerging Markets Index, as of 3/31/2026.
24 Based on a country-level breakdown of the MSCI Emerging Markets Index, as of 3/31/2026.
25 Bloomberg U.S. Aggregate Bond Index, as of 3/31/2026.
26 Bloomberg U.S. Aggregate Bond Index, as of 3/31/2026.
27 Based on a sector breakdown of the Bloomberg U.S. Aggregate Bond Index, as of 3/31/2026.
28 Bloomberg U.S. 1-5 Year Credit/Government Bond Blend Index and Bloomberg U.S. Intermediate Aggregate Bond Index, as of 12/31/2025. Limited-duration bonds are those with an average range of approximately two to three and a half years. Intermediate bonds are those with an average duration range of approximately three and half to seven years. Duration is a measure of a security’s price sensitivity to changes in interest rates. Duration differs from maturity in that it considers a security’s interest payments in addition to the amount of time until the security reaches maturity and also considers certain maturity-shortening features (e.g., demand features, interest rate resets, and call options) when applicable. Securities with longer durations generally tend to be more sensitive to interest rate changes than securities with shorter durations. A fund with a longer average duration can generally be expected to be more sensitive to interest rate changes than a fund with a shorter average duration.
29 Bloomberg U.S. 3-Month Treasury Bellwether Index, as of 3/31/2026.
30 Based on a credit quality breakdown of the Bloomberg U.S. Aggregate Bond Index, as of 3/31/2026.
31 ICE BofA U.S. High Yield Constrained Index, as of 3/31/2026.
32 Bloomberg Municipal Bond Index, as of 3/31/2026.
33 Bloomberg Managed Money Short Term Index, as of 3/31/2026.
34 Bloomberg Managed Money Muni Short/Intermediate 1-10 Year Index, as of 3/31/2026.
35 Bloomberg U.S. Treasury Inflation-Protected Securities (TIPS) Index, as of 3/31/2026.
Keep in mind that investing involves risk. The value of your investment will fluctuate over time, and you may gain or lose money.
Past performance is no guarantee of future results.
Diversification and asset allocation do not ensure a profit or guarantee against loss.
Unless otherwise noted, this commentary does not necessarily represent the views of Fidelity Investments. This commentary is for informational purposes only and is not intended to constitute a current or past recommendation, investment advice of any kind, or a solicitation of an offer to buy or sell any securities or investment services. The information and opinions presented are current only as of the date of writing without regard to the date on which you may access this information. All opinions and estimates are subject to change at any time without notice.
Data is unaudited. Information may not be representative of current or future holdings.
Stock markets are volatile and can fluctuate significantly in response to company, industry, political, regulatory, market, or economic developments. Investing in stock involves risks, including the loss of principal. Foreign investments involve greater risks than U.S. investments, including political and economic risks and the risk of currency fluctuations, all of which may be magnified in emerging markets.
Investments in smaller companies may involve greater risk than those in larger, more well-known companies.
In general, the bond market is volatile, and fixed income securities carry interest rate risk. (As interest rates rise, bond prices usually fall, and vice versa. This effect is usually more pronounced for longer-term securities.) Fixed income securities also carry inflation risk, liquidity risk, call risk, and credit and default risks for both issuers and counterparties. Any fixed income security sold or redeemed prior to maturity may be subject to loss. High yield/non-investment grade bonds involve greater price volatility and risk of default than investment grade bonds.
The municipal market can be affected by adverse tax, legislative or political changes and the financial condition of the issuers of municipal funds. Although municipal funds seek to provide interest dividends exempt from federal income taxes and some of these funds may seek to generate income that is also exempt from the federal alternative minimum tax, outcomes cannot be guaranteed, and the funds may generate some income subject to these taxes. Income from these funds is usually subject to state and local income taxes. Generally, municipal securities are not appropriate for tax-advantaged accounts such as IRAs and 401(k)s.
BLOOMBERG® is a trademark and service mark of Bloomberg Finance L.P.
Index information:
Please note that indexes are unmanaged, and performance of the indexes includes reinvestment of dividends and interest income, unless otherwise noted. Indexes are not illustrative of any particular investment, and it is not possible to invest directly in an index. Securities indexes are not subject to fees and expenses typically associated with managed accounts or investment funds.
CBOE Volatility Index (VIX) measures the market's expectation of 30-day volatility for the S&P 500.
Dow Jones US Total Stock Market Index is a float-adjusted market capitalization–weighted index of all equity securities of US headquartered companies with readily available price data.
Russell 1000 Growth Index is a market capitalization-weighted index designed to measure the performance of the large-cap growth segment of the U.S. equity market. It includes those Russell 1000 Index companies with higher price-to-book ratios and higher forecasted growth rates.
Russell 1000 Value Index is a market capitalization-weighted index designed to measure the performance of the large-cap value segment of the U.S. equity market. It includes those Russell 1000 Index companies with lower price-to-book ratios and lower expected growth rates.
Russell 2000 Index is a market capitalization-weighted index designed to measure the performance of the small-cap segment of the U.S. equity market. It includes approximately 2,000 of the smallest securities in the Russell 3000 Index.
S&P 500 Index is a market capitalization–weighted index of 500 common stocks chosen for market size, liquidity, and industry group representation to represent US equity performance. Bloomberg Commodity Index Total Return measures the performance of the commodities market. It consists of exchange-traded futures contracts on physical commodities that are weighted to account for the economic significance and market liquidity of each commodity.
Bloomberg Precious Metals Index measures the performance of two future contracts on precious metals: gold and silver. It is a multiple-commodity sub-index consisting of the contracts included in the Dow Jones-UBS Commodity Index related to precious metals.
Russell Midcap Index is a market capitalization-weighted index designed to measure the performance of the mid-cap segment of the U.S. equity market. It contains approximately 800 of the smallest securities in the Russell 1000 Index.
FTSE NAREIT All REITs Index is a market capitalization–weighted index that is designed to measure the performance of all tax–qualified Real Estate Investment Trusts (REITs) that are listed on the New York Stock Exchange, the NYSE MKT LLC, or the NASDAQ National Market List.
MSCI ACWI (All Country World Index) ex USA Index (Net MA Tax) is a market capitalization-weighted index designed to measure investable equity market performance for global investors of large and mid-cap stocks in developed and emerging markets, excluding the United States. Index returns are adjusted for tax withholding rates applicable to U.S. based mutual funds organized as Massachusetts business trusts (NR).
MSCI Emerging Markets Index (Net MA Tax) is a market capitalization-weighted index that is designed to measure the investable equity market performance for global investors in emerging markets. Index returns are adjusted for tax withholding rates applicable to U.S. based mutual funds organized as Massachusetts business trusts (NR).
The Bloomberg Municipal Bond Index is a market value-weighted index of investment-grade municipal bonds with maturities of one year or more.
Bloomberg US Aggregate Bond Index is a broad-based flagship benchmark that measures the investment grade, US dollar-denominated, fixed-rate taxable bond market. The index includes Treasuries, government-related and corporate securities, mortgage-back securities (agency fixed-rate pass-throughs), asset-backed securities and collateralized mortgage-backed securities (agency and non-agency).
ICE Bofa US High Yield Constrained index is designed to track the performance of U.S. dollar-denominated high-yield corporate bonds that that meet specific criteria. These bonds must have at least $250 million in outstanding face value, an original maturity of at least 15 months and a maturity of at least one-year. The index includes bonds with ratings between BB1 and B3, based on an average of Moody’s, S&P and Fitch, and excludes those with lower ratings.
Bloomberg U.S. 1-10 Year Treasury Inflation-Protected Securities (TIPS) Index (Series-L) is a market value-weighted index that measures the performance of inflation-protected securities issued by the U.S. Treasury that have a remaining average life between 1 and 10 years.
Bloomberg Municipal Bond Index is a market value–weighted index of investment–grade municipal bonds with maturities of one year or more.
Bloomberg Managed Money Muni Short/Intermediate (1-10) Index is a flagship measure of the USD-denominated tax-exempt bond market over 1 year to maturity. The index includes four main sectors: state and local general obligation bonds, revenue bonds, insured bonds, and pre-refunded bonds.
The Bloomberg Municipal Managed Money Short Index measures the performance of the tax-exempt bond market and the investment grade fixed rate bond market, with index components for education, government public service, and transportation & utility with remaining time to maturity of 1-5 years. It is a rules-based, market-value-weighted index. This index is the MM Short (1-5) component of the Managed Money index.
Bloomberg Commodity Index is designed to be a highly liquid and diversified benchmark for commodity investments. BCOM provides broad-based exposure to commodities and no single commodity or sector dominates the Index
Bloomberg Industrial Metals Index is composed of futures contracts on aluminum, copper, nickel, lead and zinc. It reflects the return of underlying commodity futures price movements only.
Bloomberg 1-5 Yr Gov/Credit Index tracks the subset of bonds in the flagship Bloomberg US Government/Credit Index with at least one year and up to, but not including, five years until final maturity.
The Bloomberg Intermediate US Aggregate Bond Index is a broad-based flagship benchmark that measures the investment grade, US dollar-denominated, fixed-rate taxable bond market with less than 10 years to maturity. The securitized sector is wholly included.
Bloomberg US 3-month Treasury Bellwether Index tracks the performance of the most recently issued U.S. Treasury securities with a maturity of 3 months. This index is designed to reflect the most recently issued U.S. Treasury securities and is used to track the performance of the U.S. Treasury market. The index is market capitalization weighted, meaning that the securities with the largest market capitalization are given more weight in the index.
MSCI Japan Index measures the performance of the Japanese equity market. It consists of stocks traded primarily on the Tokyo Stock Exchange, capturing a broad part of Japan's market capitalization.
MSCI Canada Index measures the performance of the large and mid-cap segments of the Canadian market.
MSCI German Index is designed to measure the performance of the large and mid-cap segments of the German market covering approximately 85% of the equity universe in Germany.
MSCI France Index is designed to measure the performance of the large and mid-cap segments of the French market. It covers approximately 85% of the equity universe in France.
S&P GSCI Agriculture and Livestock Index is a sub-index of the S&P GSCI that provides a benchmark for investment performance in the agriculture and livestock commodities markets.
Fidelity does not provide legal or tax advice. The information herein is general in nature and should not be considered legal or tax advice. Consult an attorney or tax professional regarding your specific situation.
Clients are responsible for all tax liabilities arising from transactions in their accounts, for the adequacy and accuracy of any positions taken on tax returns, for the actual filing of tax returns, and for the remittance of tax payments to taxing authorities.
Fidelity® Wealth Services provides non-discretionary financial planning and discretionary investment management through one or more Personalized Portfolios accounts for a fee. Advisory services offered by Strategic Advisers LLC (Strategic Advisers), a registered investment adviser. Brokerage services provided by Fidelity Brokerage Services LLC (FBS), and custodial and related services provided by National Financial Services LLC (NFS), each a member NYSE and SIPC. Strategic Advisers, FBS, and NFS are Fidelity Investments companies.
Fidelity Brokerage Services LLC, Member NYSE, SIPC, 900 Salem Street, Smithfield, RI 02917
© 2026 FMR LLC. All rights reserved.
556487.102.1
How Fidelity Charitable can help
Since 1991, we have been a leader in charitable planning and giving solutions, helping donors like you support their favorite charities in smart ways.
Or call us at 800-262-6039